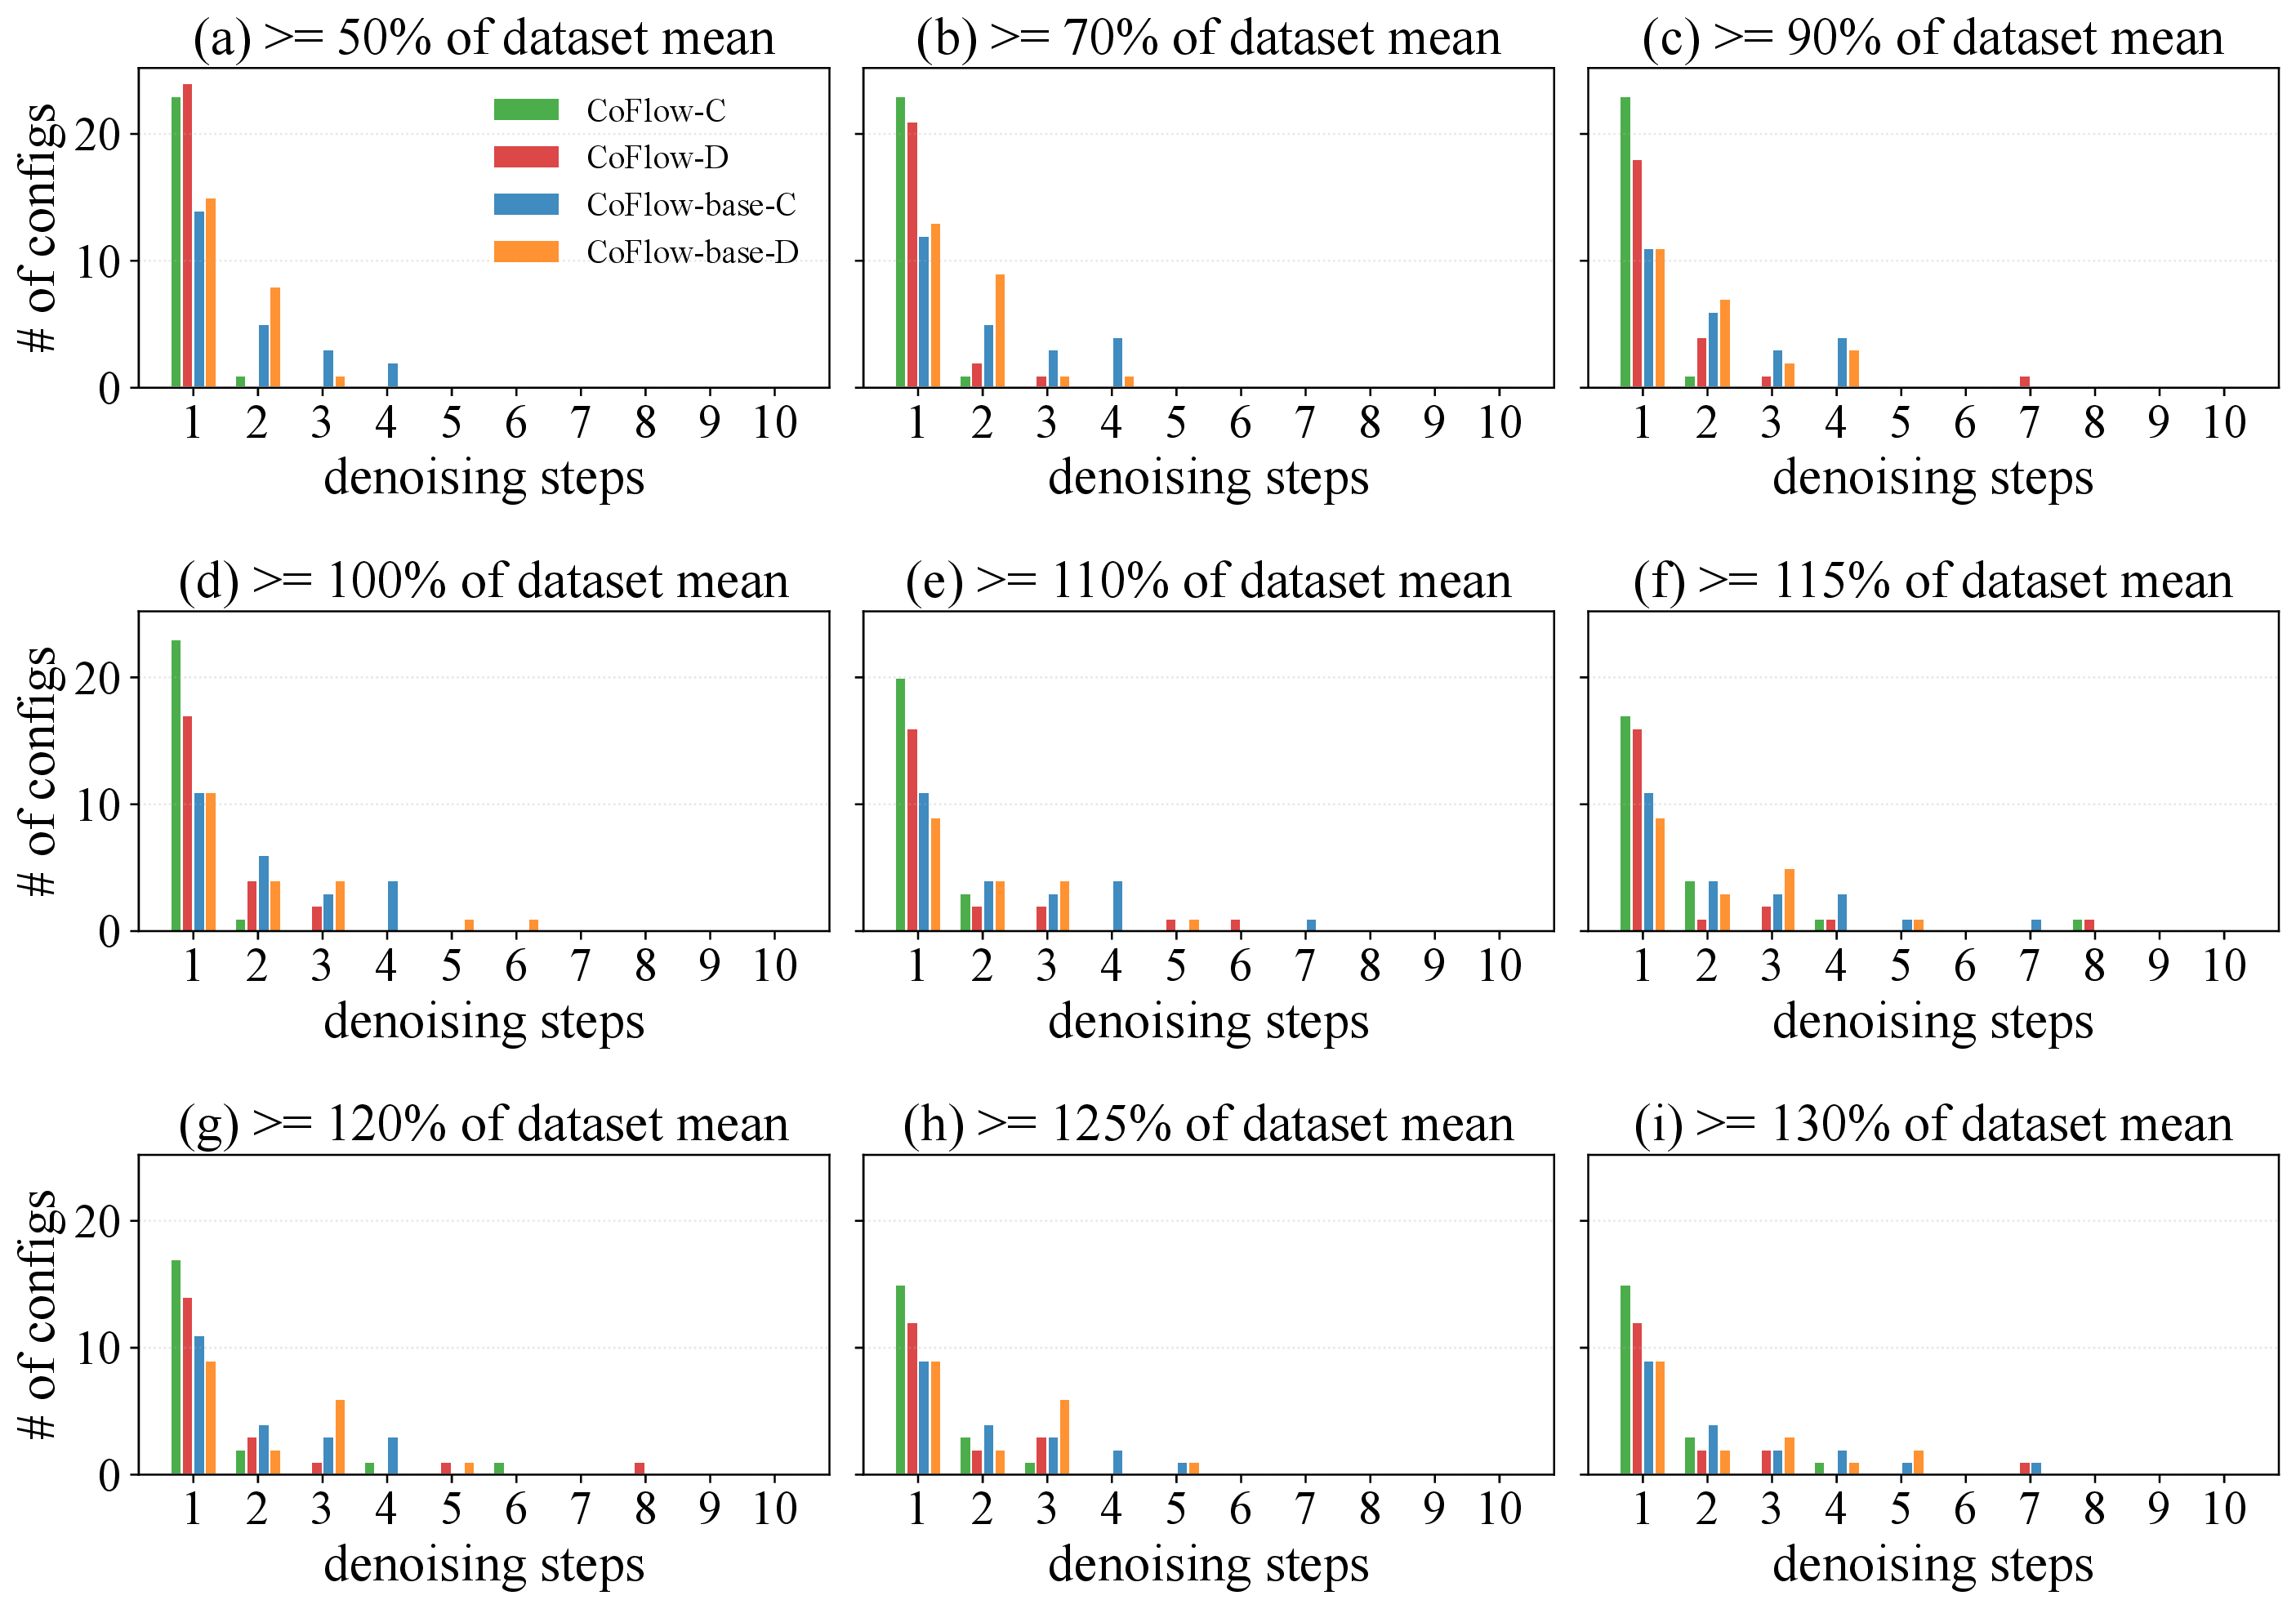
Benchmark Results

We evaluate centralized and decentralized CoFlow on 48 configurations across MPE and SMAC. CoFlow-C improves over our reproduced MADiff-C baseline by 11.2%, averaging relative gains equally across the two benchmark suites.

The table below is taken directly from the updated paper. MPE reports OMAR-normalized scores; SMAC reports episode return. Click any figure to inspect it at full resolution.
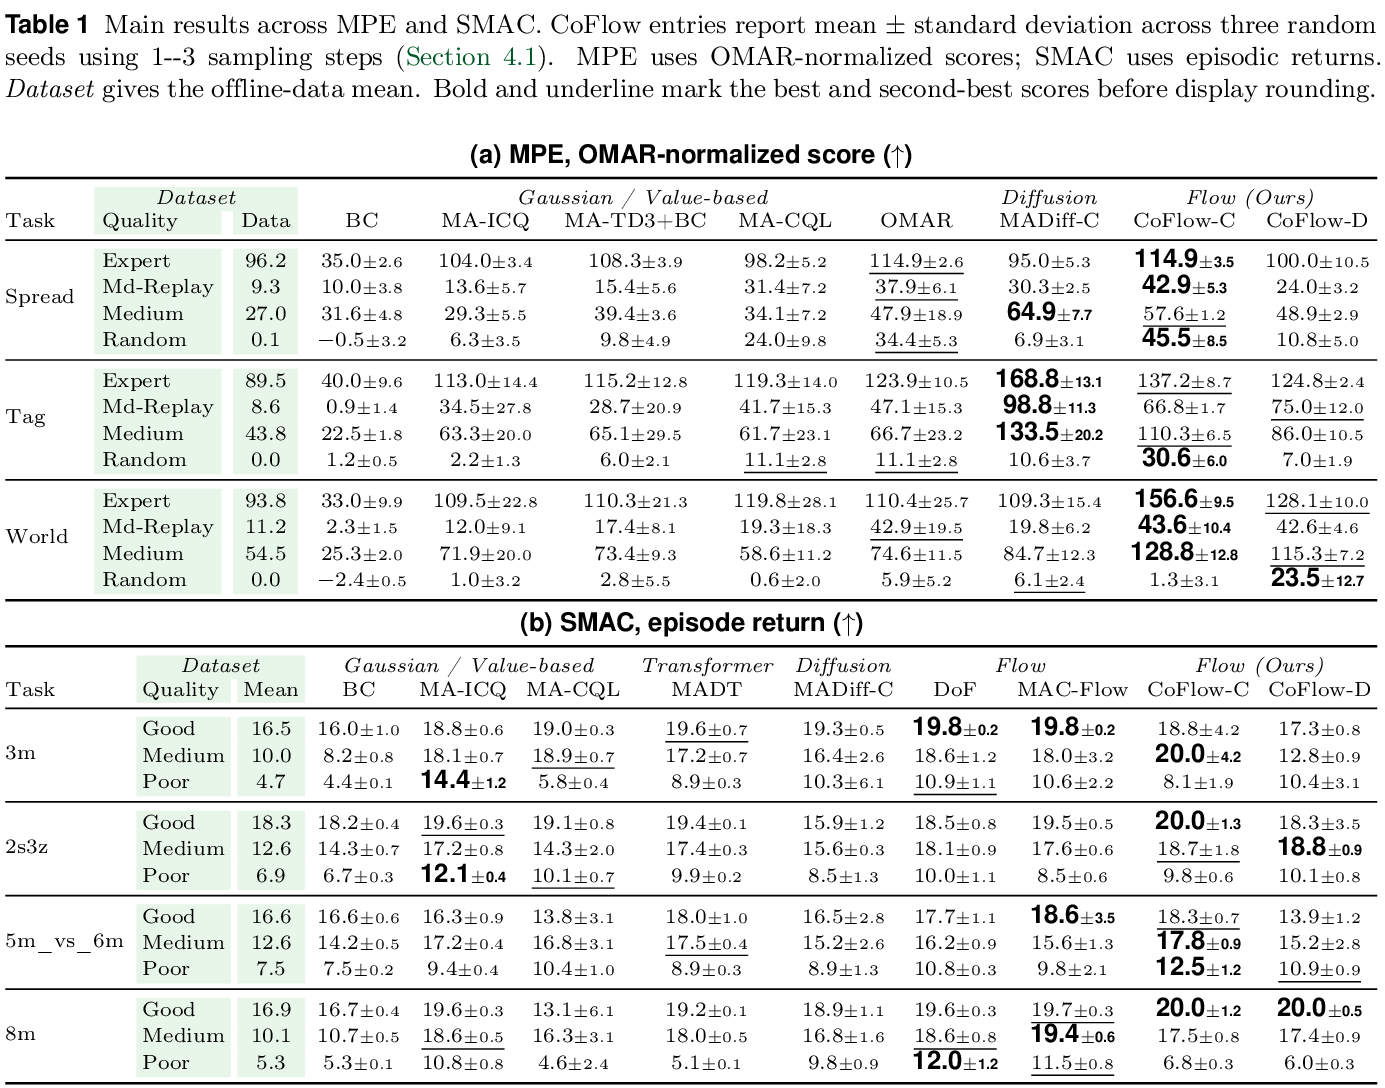
Table 1. Updated MPE and SMAC results. Bold and underline indicate the best and second-best scores in each row.

Coordination Evidence

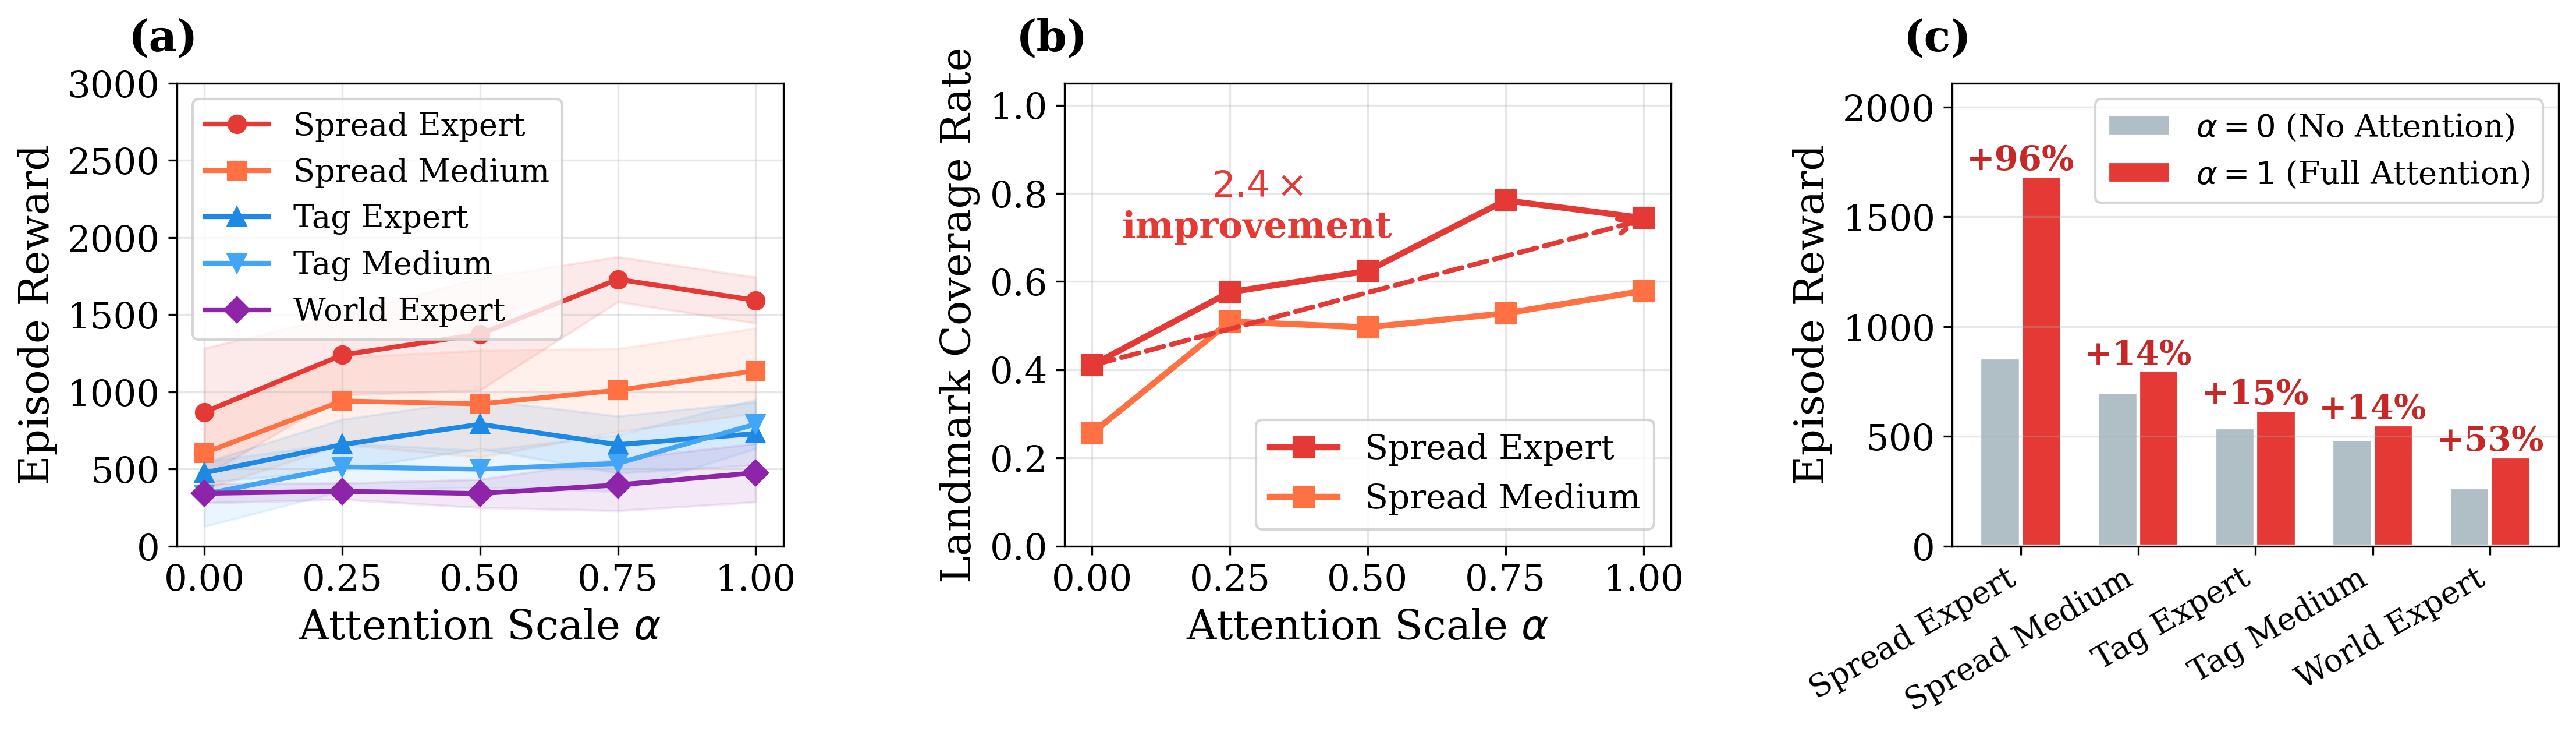
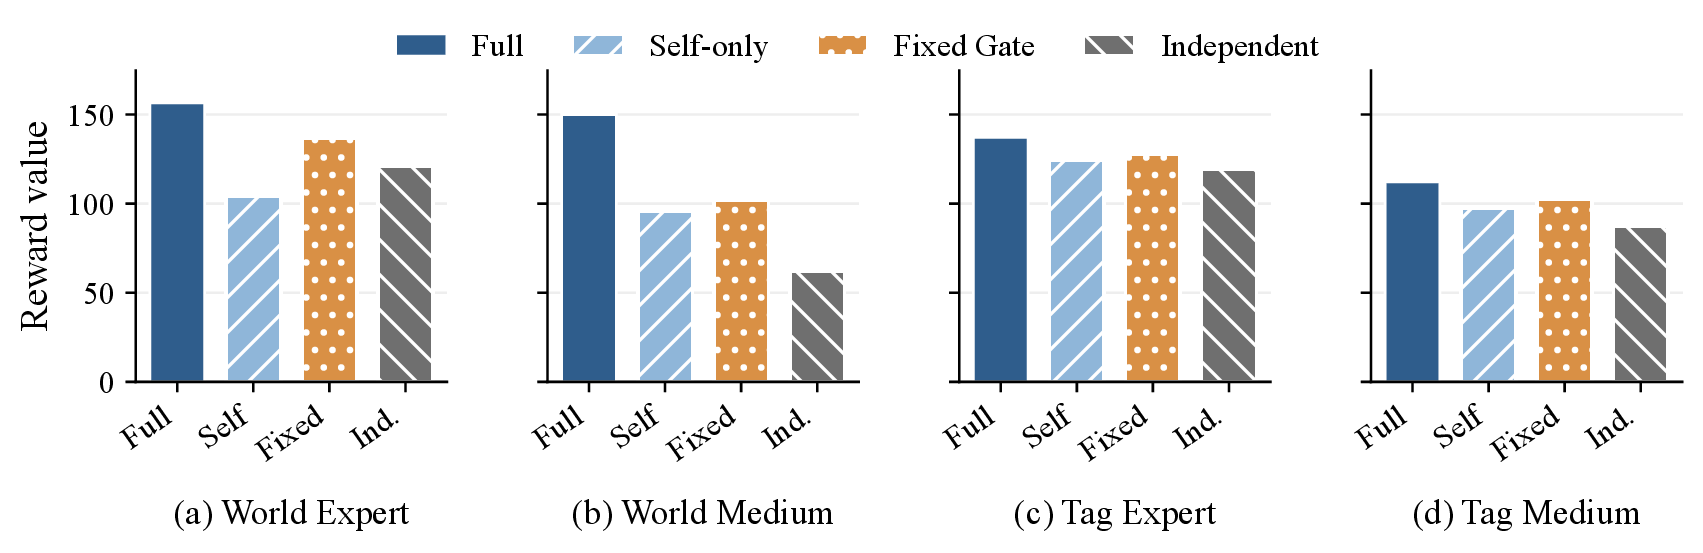
The paper examines how CVA strength relates to reward, landmark coverage, and the effect of disabling cross-agent attention. Full CVA improves normalized scores by 165.1% on average over the same model with cross-agent attention disabled.

Figure 3. CVA scale, landmark coverage, and attention ablation in MPE.
Figure 4. Mechanism ablations: full CVA, self-only attention, fixed gating, and independent generation.
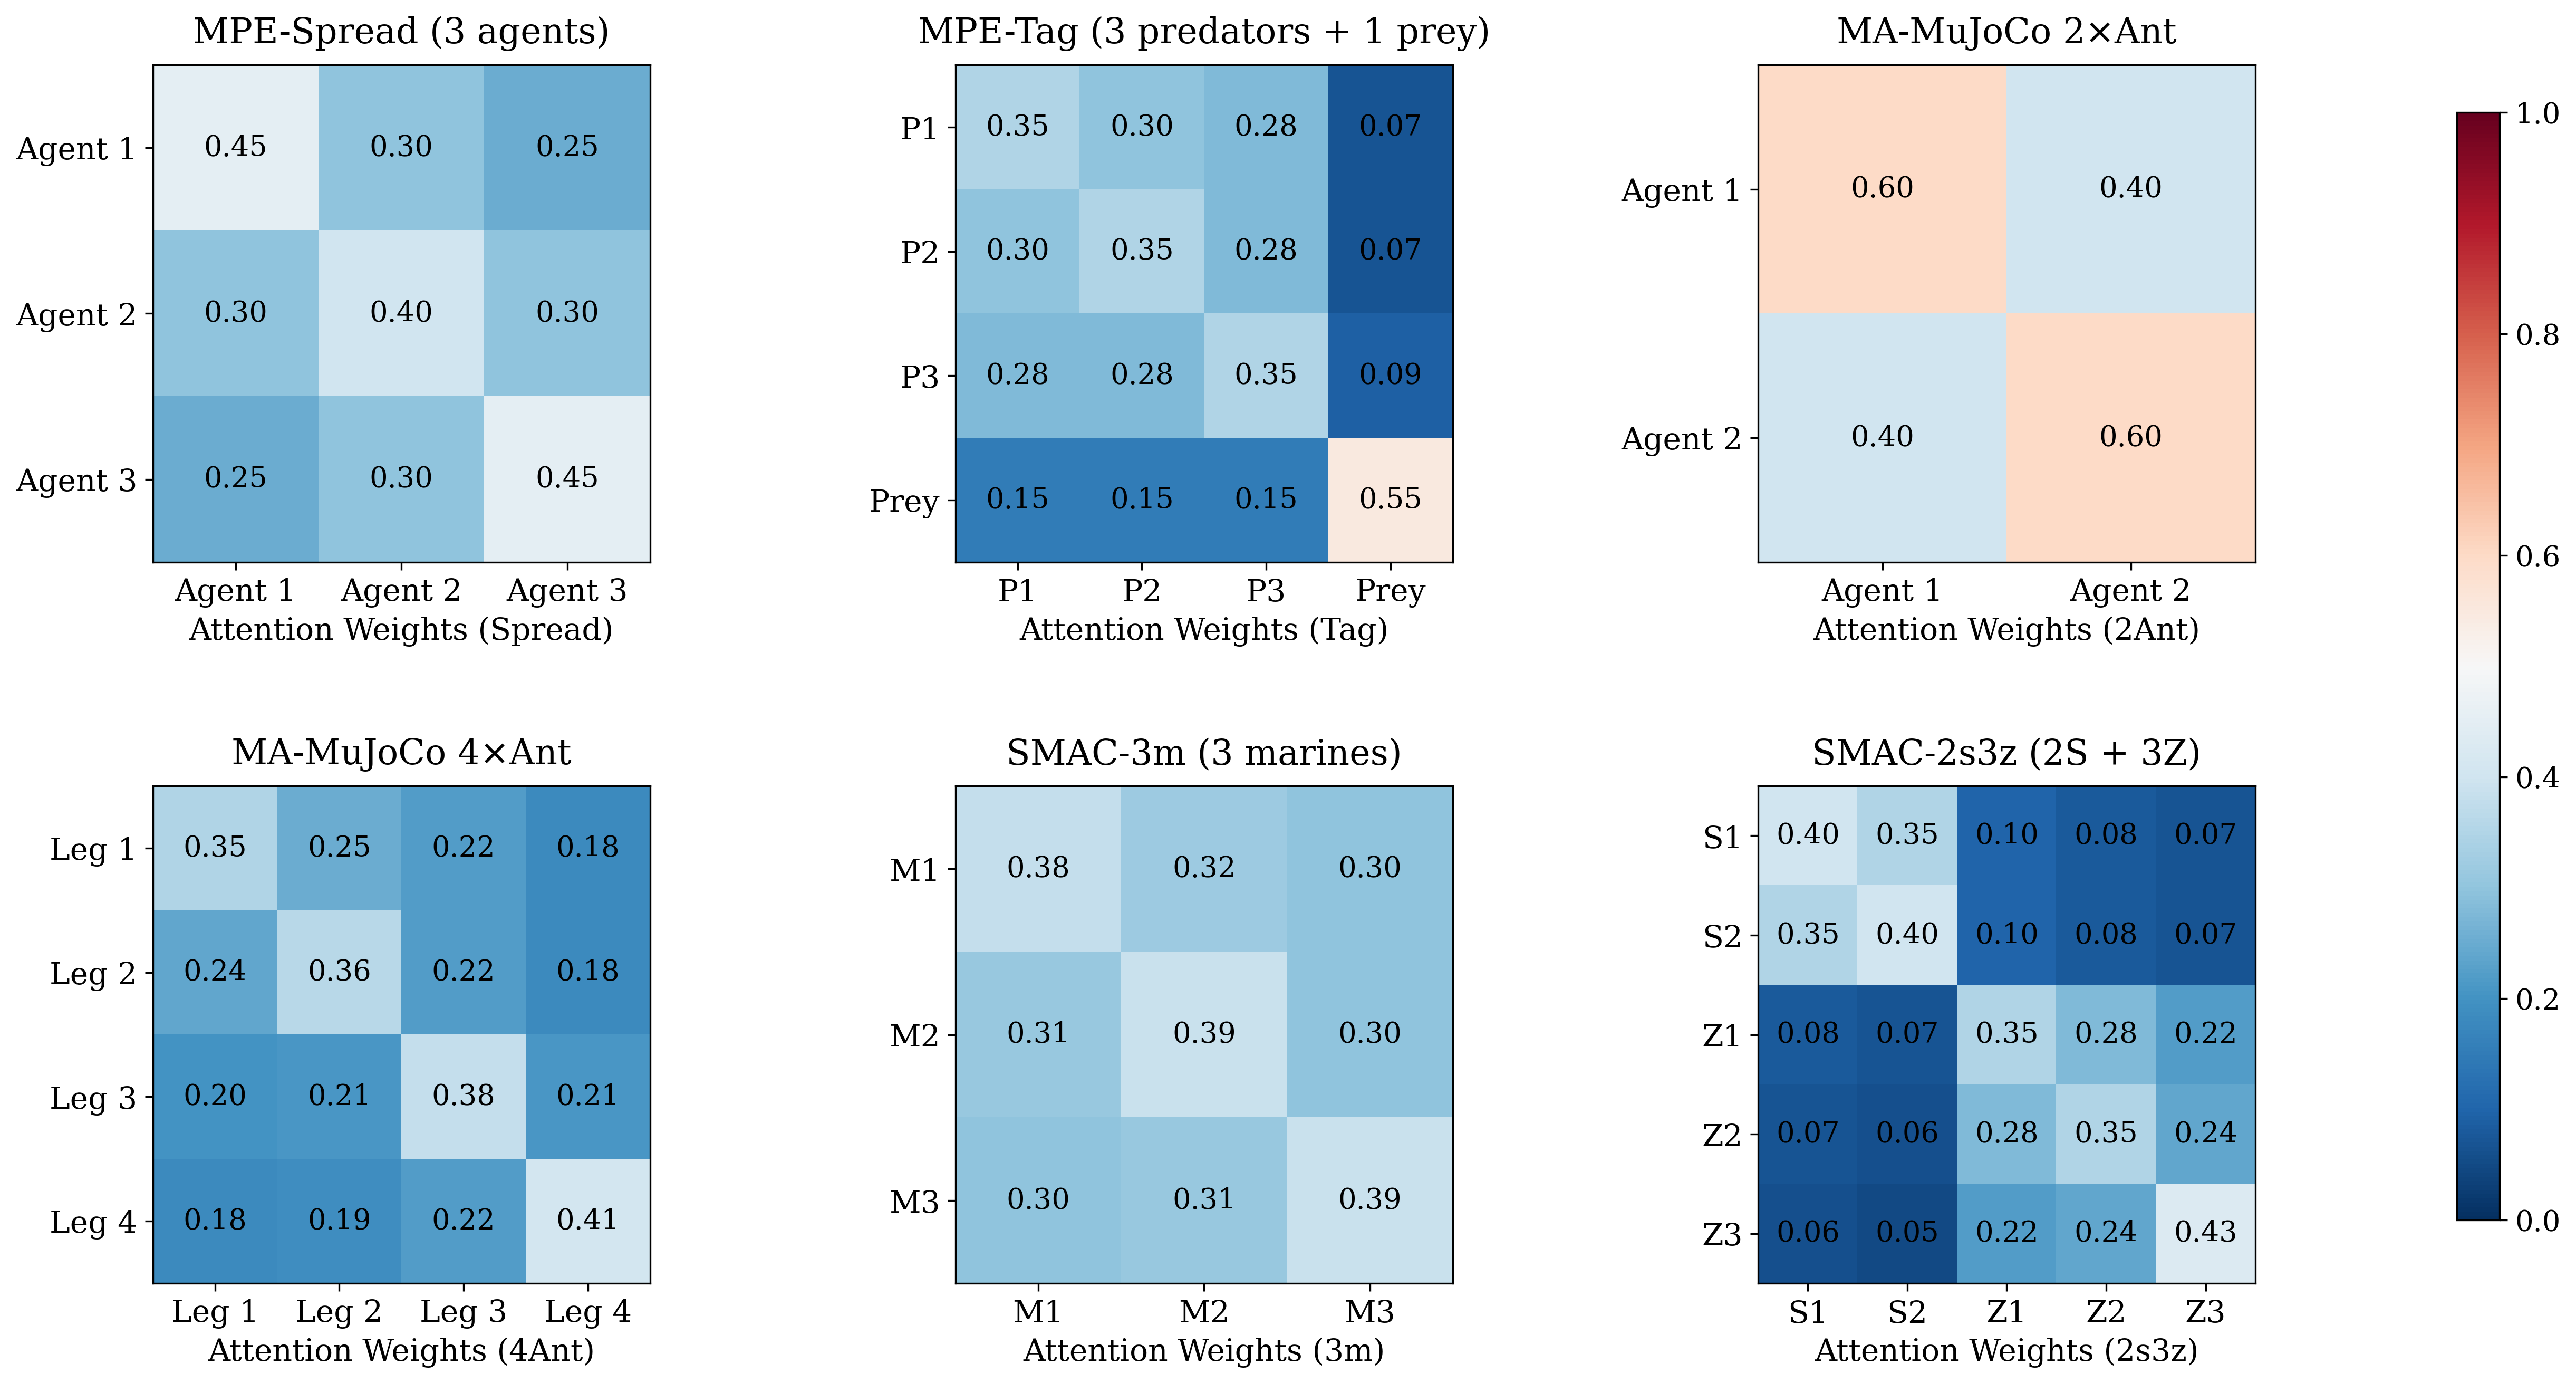
Figure 5. Learned attention weights for MPE and SMAC tasks.

Training and Inference Efficiency

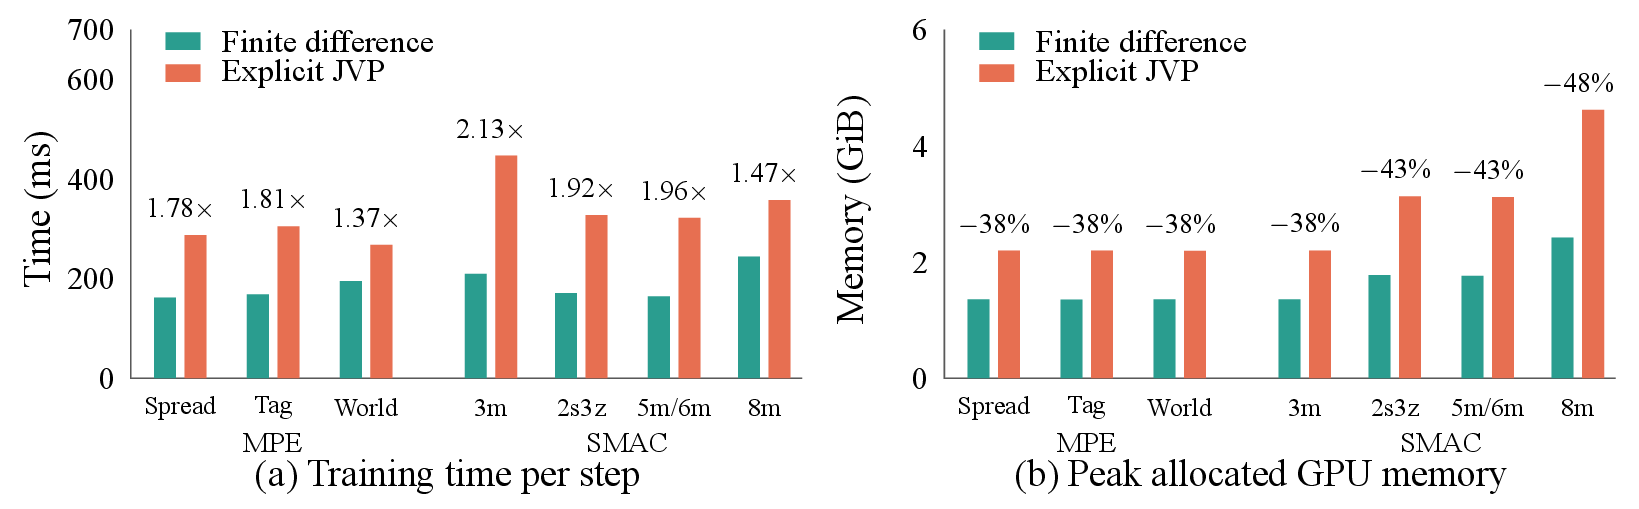
1.78× faster training updates

Finite-difference training reduces peak GPU memory by 41.1% compared with the tested exact-derivative implementation.

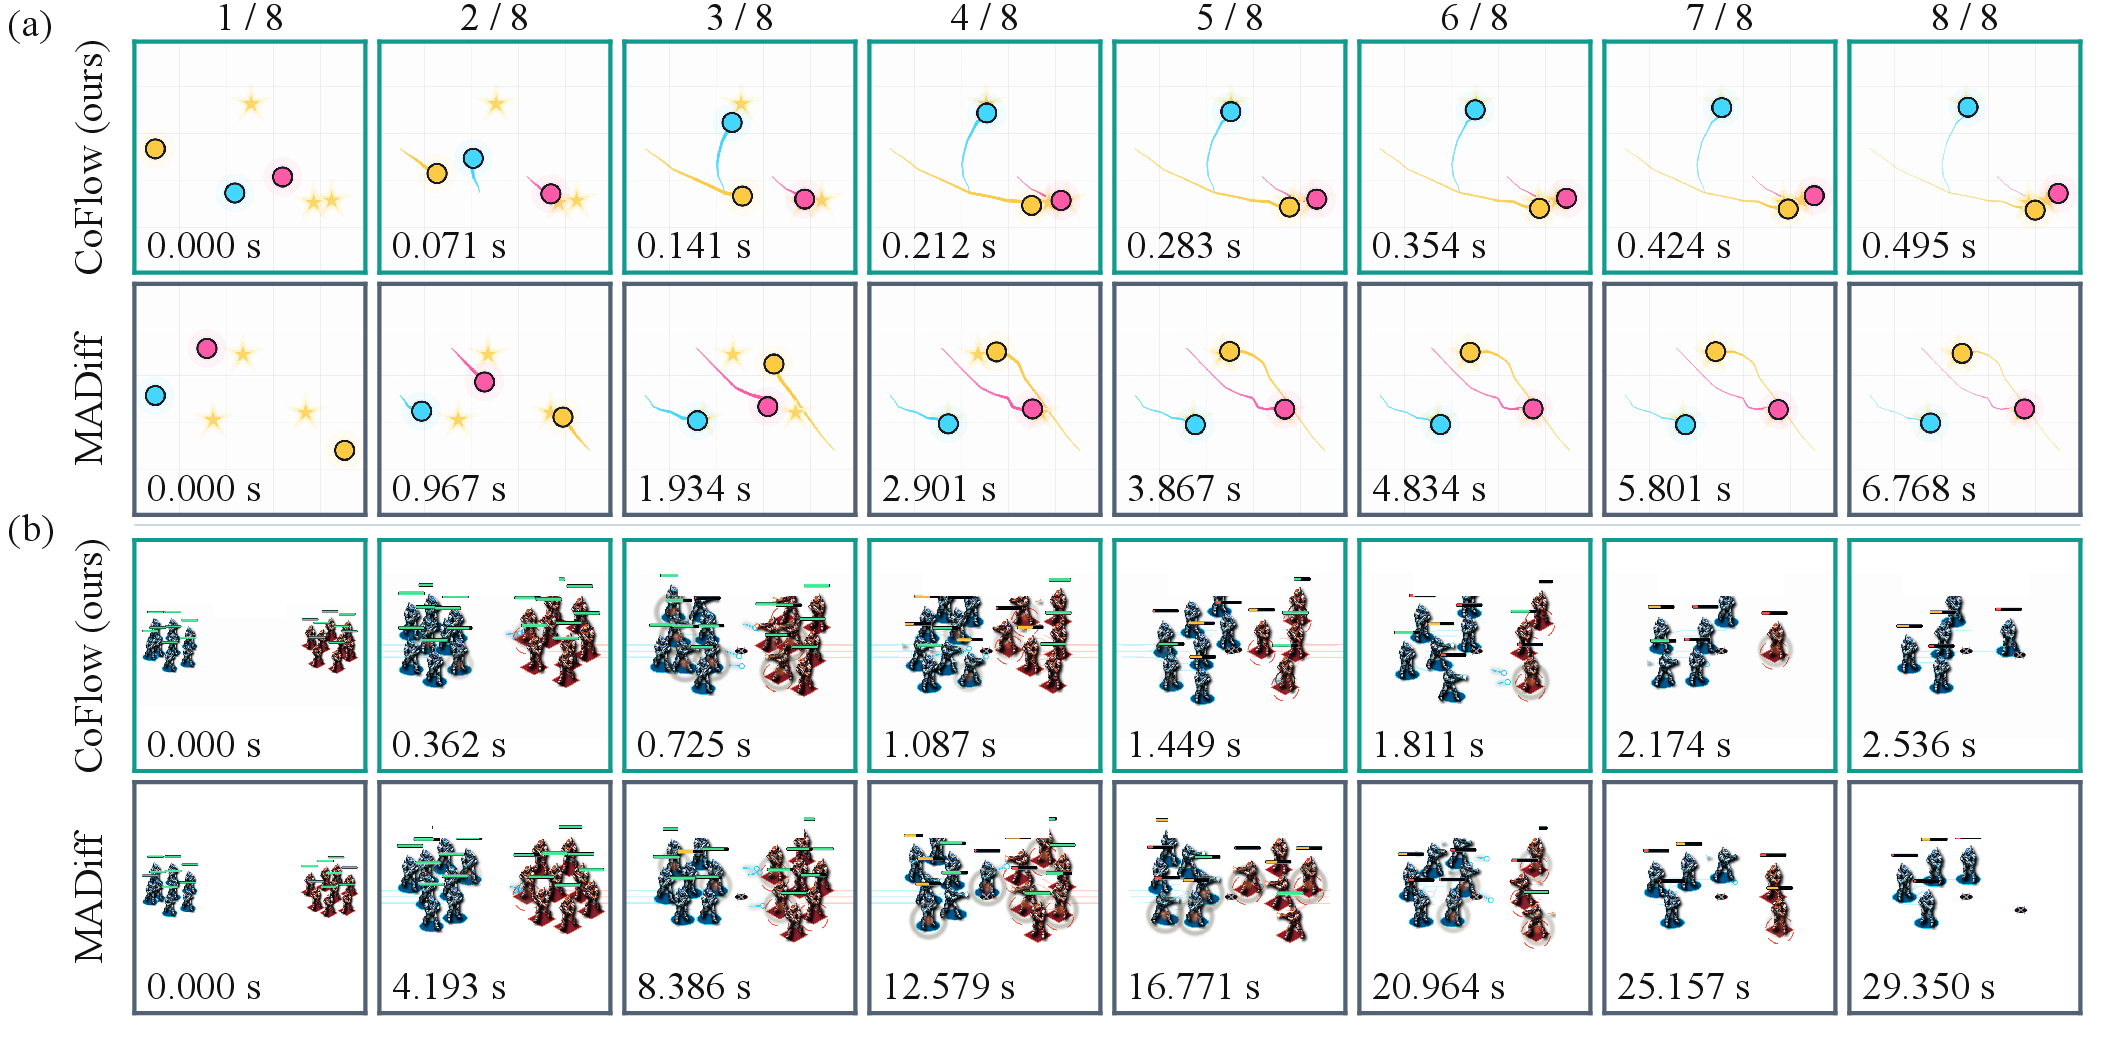
12.93× faster model sampling

One-step CoFlow is compared with 15-step DDIM sampling in the reproduced MADiff baseline.

Training measurements use matched synthetic batches on an A100 and average across seven task shapes. Inference measurements cover model sampling only, excluding environment simulation and rendering.

Figure 6. Per-update training time and peak GPU memory across seven task shapes.
Figure 7. MPE-Spread and SMAC-8m trajectories with accumulated model-sampling time.

Few-Step Performance

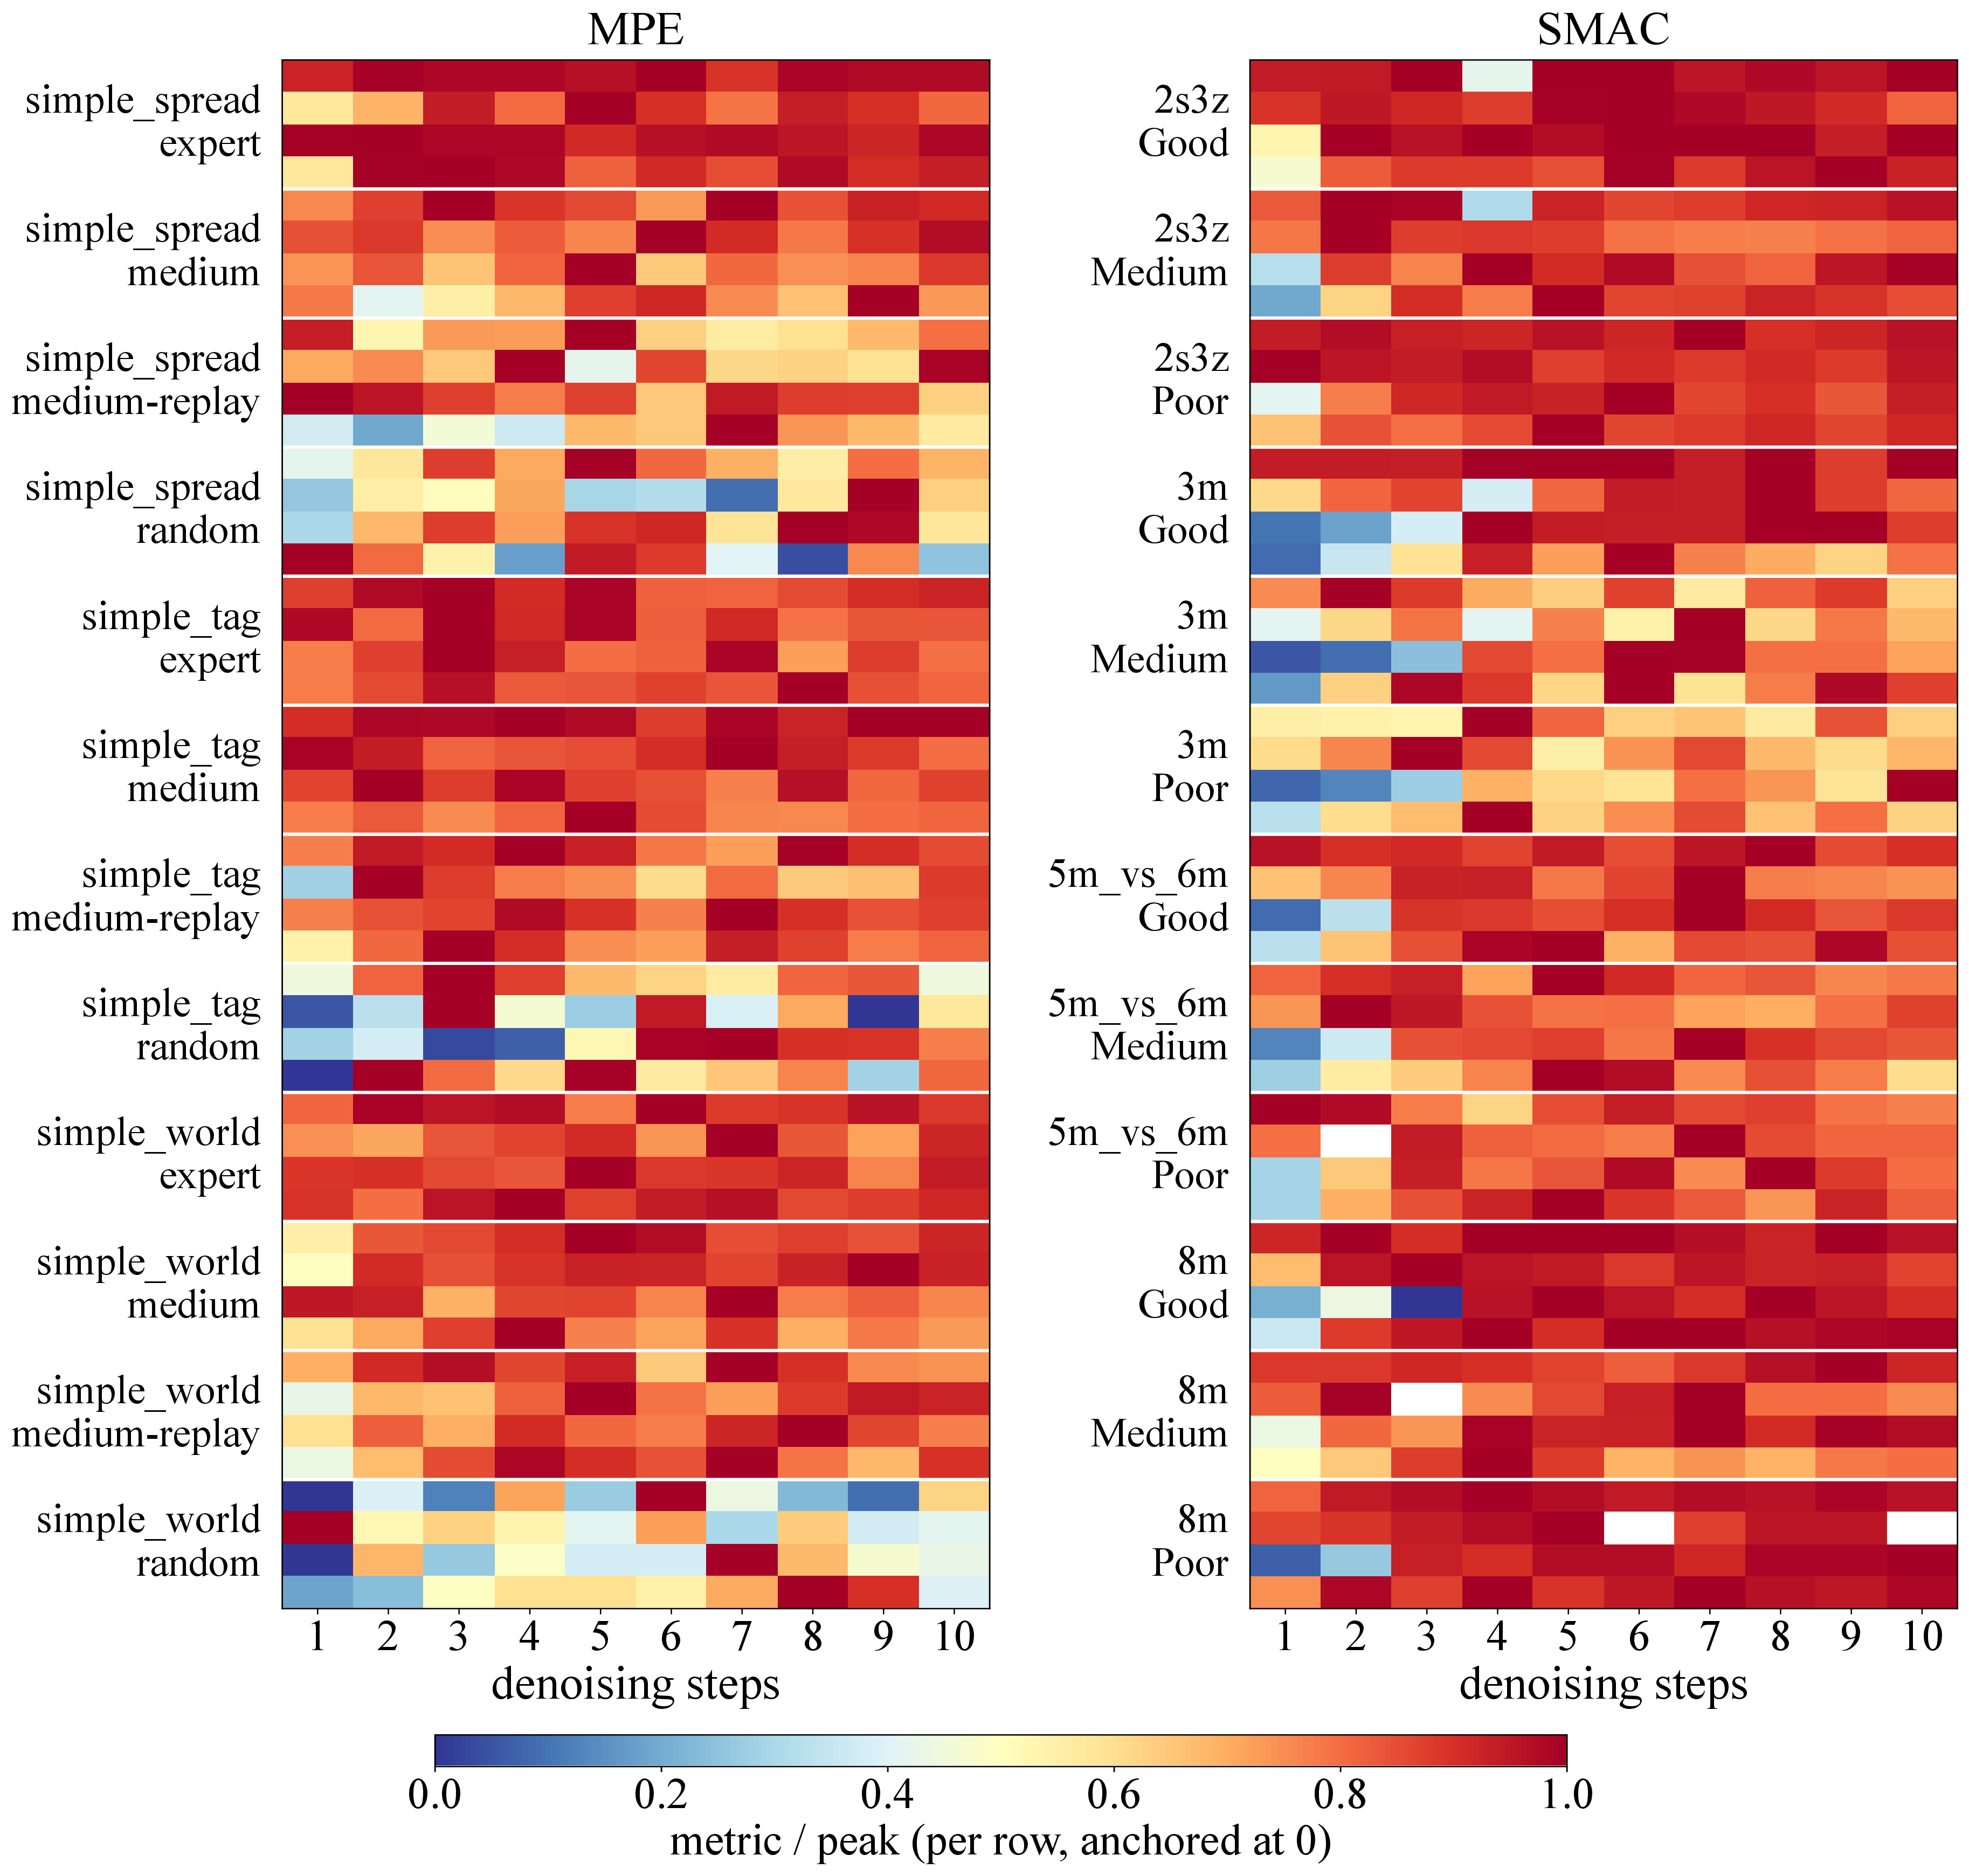
The updated heatmap shows performance across sampling budgets for CoFlow-C, CoFlow-D, CoFlow-base-C, and CoFlow-base-D. One or a few steps achieve strong performance in most configurations; some settings benefit from additional refinement.

Figure 9. MPE and SMAC performance versus denoising-step budget, normalized by each row’s peak.
Figure 11. Steps needed to reach target percentages of the offline dataset mean.